New dashboard provides in-depth look at energy use on campus
New dashboard provides in-depth look at energy use on campus
and BU is the first PASSHE school to implement it.
Anyone strolling around Bloomsburg University’s campus may have noticed a new kiosk resembling a bus shelter past the northeast side of Ben Franklin Hall. Behind it sits two light poles topped with solar panels.

The kiosk is phase two of a four-phase energy project coordinated by BU faculty members Nathaniel Greene and Jeff Brunskill and assistant director of facilities management John Holtzman. The kiosk is designed to educate the BU community about solar energy and the university’s energy consumption using Lucid Design Group’s Building Dashboard software. The project ultimately aims to develop energy-saving strategies for the university.
The project’s first phase began with the commissioning of a 14-panel solar array next to Ben Franklin Hall on Jan. 6, 2012, funded internally by a 2011 President’s Strategic Planning grant.
Then, with an external grant from Constellation Energy and a large amount of student involvement, work began on the kiosk. Contributions were made by students and faculty from the following academic departments at BU: physics and engineering technology; environmental, geographical, and geological sciences; mathematics, computer science and statistics; and instructional technology.
Designed to complement the appearance of the Academic Quad, the kiosk was modeled after the existing bus shelters on campus. It also features two small solar panels designed for educational purposes, which sit atop poles that match the Quad’s light poles.
Computer science students working with faculty member Curt Jones wrote the software that controls the kiosk’s two solar panels. One panel is programmed to automatically follow the movement of the sun to maximize the energy gathered. The other panel can be controlled by using the kiosk’s large touchscreen computer.
The kiosk uses colored lights and digits to show users how much power, in watts, and energy, in watt-hours, each panel is producing.
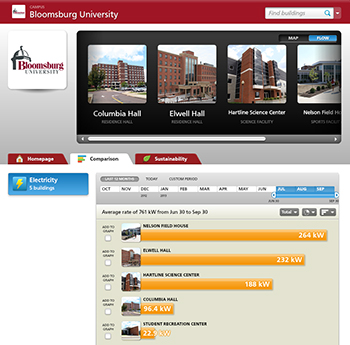
The Building Dashboard touchscreen software will also allow users to take an in-depth look at energy use in five campus buildings: Hartline Science Center, Student Recreation Center, Nelson Field House, Columbia Residence Hall and Elwell Residence Hall. These buildings were chosen because they are popular with students or large consumers of energy, according to Greene.
Previously, electrical data for these buildings were gathered by manually reading meters once a month. BU’s heating, ventilation and air conditioning are controlled by a Siemen’s Apogee Building Automation System (BAS). The BAS has been upgraded for the five buildings to download meter readings every 15 minutes and transmit them to the BU Building Dashboard.
Users can view this real-time data on the touchscreen by selecting a building. The building’s total electricity use can be tracked by the day, week, month or year. Using the touchscreen, users can also compare buildings on layered graphs, look at the effects of weather on energy consumption and connect to Facebook to leave comments and encourage dialogue about energy use. The amount of carbon dioxide emitted by power plants to provide the buildings’ electricity and the cost of energy in dollars can also be tracked.
Over time, the kiosk and the data that it tracks and displays will be put to good use. BU students in energy- and environment-related courses will be able to utilize the interactive software for class, and research students will be able to access raw data for their own projects. The next phase of the energy project will be to monitor the data over time and raise awareness about energy issues on campus and in general.
Later, the data and trends revealed by the Building Dashboard software will be used in the final phase of the project, which is to develop strategies to reduce energy use. #BUSustainability
— Nick Cellucci ’16
